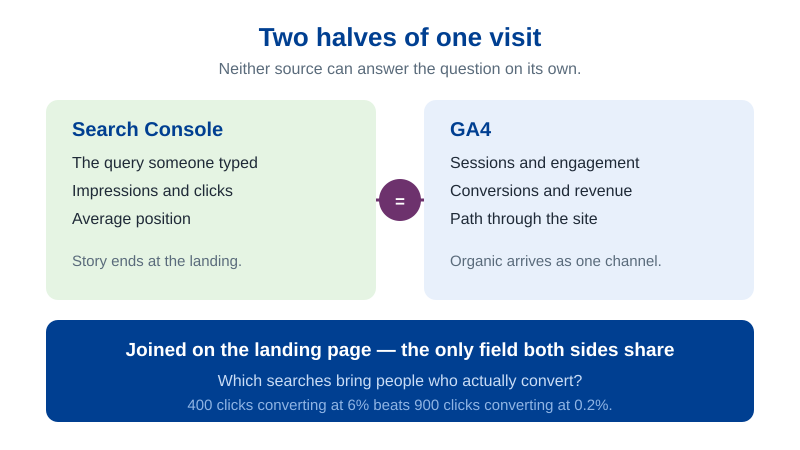
Search Console knows what people searched for. GA4 knows what they did next. Neither answers the question clients actually ask — which search queries bring people who convert — and that’s why a Looker Studio blend of GA4 and Search Console data is worth the afternoon it takes to get right.
I’ve built this blend for six clients. The first two attempts produced reports that looked convincing and were wrong, which taught me more than the four that worked. When you blend data in Looker Studio you are writing a join, and a join on the wrong key returns numbers that are plausible and meaningless.
Here’s the version that survives a real dataset: which Search Console table to connect, how to clean the join key with REGEXP_REPLACE, what belongs in the blended table, and why the totals will never agree.
Table of Contents
- Why one source is never enough
- What lives where: GA4 vs Search Console fields
- Site Impression or URL Impression?
- The join key decides everything
- Wiring the two sources together
- Which metrics and dimensions belong in the blend
- Calculated fields worth adding
- Why the totals will not match
- Mistakes that quietly break the blend
- When a blend is the wrong tool
- Frequently asked questions
Why one source is never enough
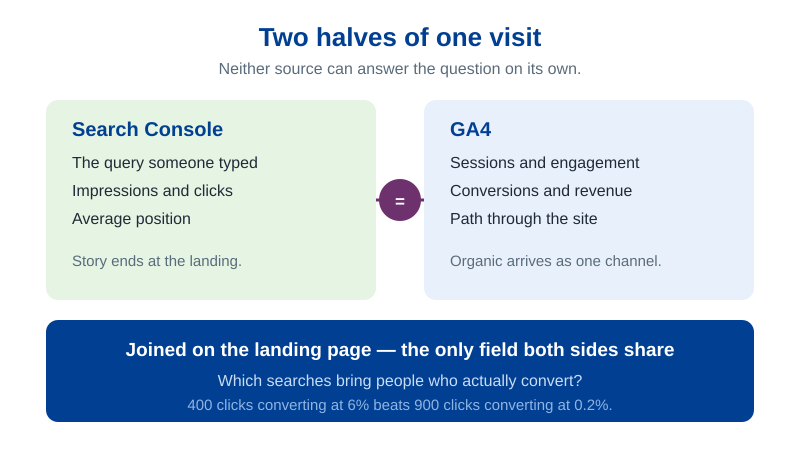
Google Search Console (GSC) reports the search side of a visit: query, impression, click, position. Its story ends the instant somebody lands on your page. Google Analytics 4 (GA4) picks it up there and follows through to the conversion, but has no idea which query brought the person in — organic is one undifferentiated channel to it.
That split isn’t a bug; it reflects what each tool is allowed to see. But it leaves the most useful question in organic reporting stranded in the gap. Your comparison-keyword page gets 400 clicks a month and converts at 6%; the definition-keyword page gets 900 and converts at 0.2%. From either source alone, both look like wins.
What the native Search Console to GA4 link gives you, and where it stops
You can link the two without Looker Studio at all — Admin → Product links → Search Console links — and I turn it on for every property; the walkthrough is in my GA4 setup guide. It stops short in three places: its queries report slices only by Search Console dimensions, so a query never sits beside a conversion; its landing-page report breaks down by country and device; and it takes no calculated fields and no third source.
What lives where: GA4 vs Search Console fields
Before you combine GA4 and Search Console data in the blend editor, be precise about which fields each source owns and which only look shared. Every wrong join I’ve seen came from the last column.
| Field | Search Console (URL Impression) | GA4 | Role in the blend |
|---|---|---|---|
| Query | Yes | No | Search Console only — keep it out of the joined table |
| Landing page | Full URL, canonicalized by Google | Path only (or path + query string) | Join key after cleanup |
| Clicks, Impressions, CTR, Average Position | Yes | No | Search-side metrics |
| Sessions, Engaged sessions, Engagement rate | No | Yes | Site-side metrics |
| Key events (conversions), Revenue | No | Yes | The reason the blend exists |
| Device category | Yes | Yes | Optional second join field — in both tables and in the join, or in neither |
| Country | Yes | Yes | Same rule as device |
| Date | Yes (Pacific time) | Yes (property time zone) | Same rule again — and never a join field on its own |
| Session source / medium | No | Yes | Filter the GA4 table to google / organic |
Two rows decide the design: query lives on one side only, and landing page is the only genuinely shared field — which is why the build is really about cleaning it.
Site Impression or URL Impression?
Use URL Impression. The connector makes you pick one of two tables per data source, and only URL Impression carries the Landing Page dimension you need as the join key. Site Impression aggregates by property and has no page field, so there’s nothing to join to.
The distinction mirrors how Search Console counts. Grouped by property, two results from one site on the same results page count as one impression; grouped by page, each URL gets its own. So URL Impression totals run higher for the same property and range, and the metrics are named differently — URL Clicks and URL CTR on the page table, Clicks and Site CTR on the site table.
If the client also wants property-level headline numbers, connect a second Search Console source on Site Impression and use it for scorecards only — never blend that one with GA4.
The join key decides everything
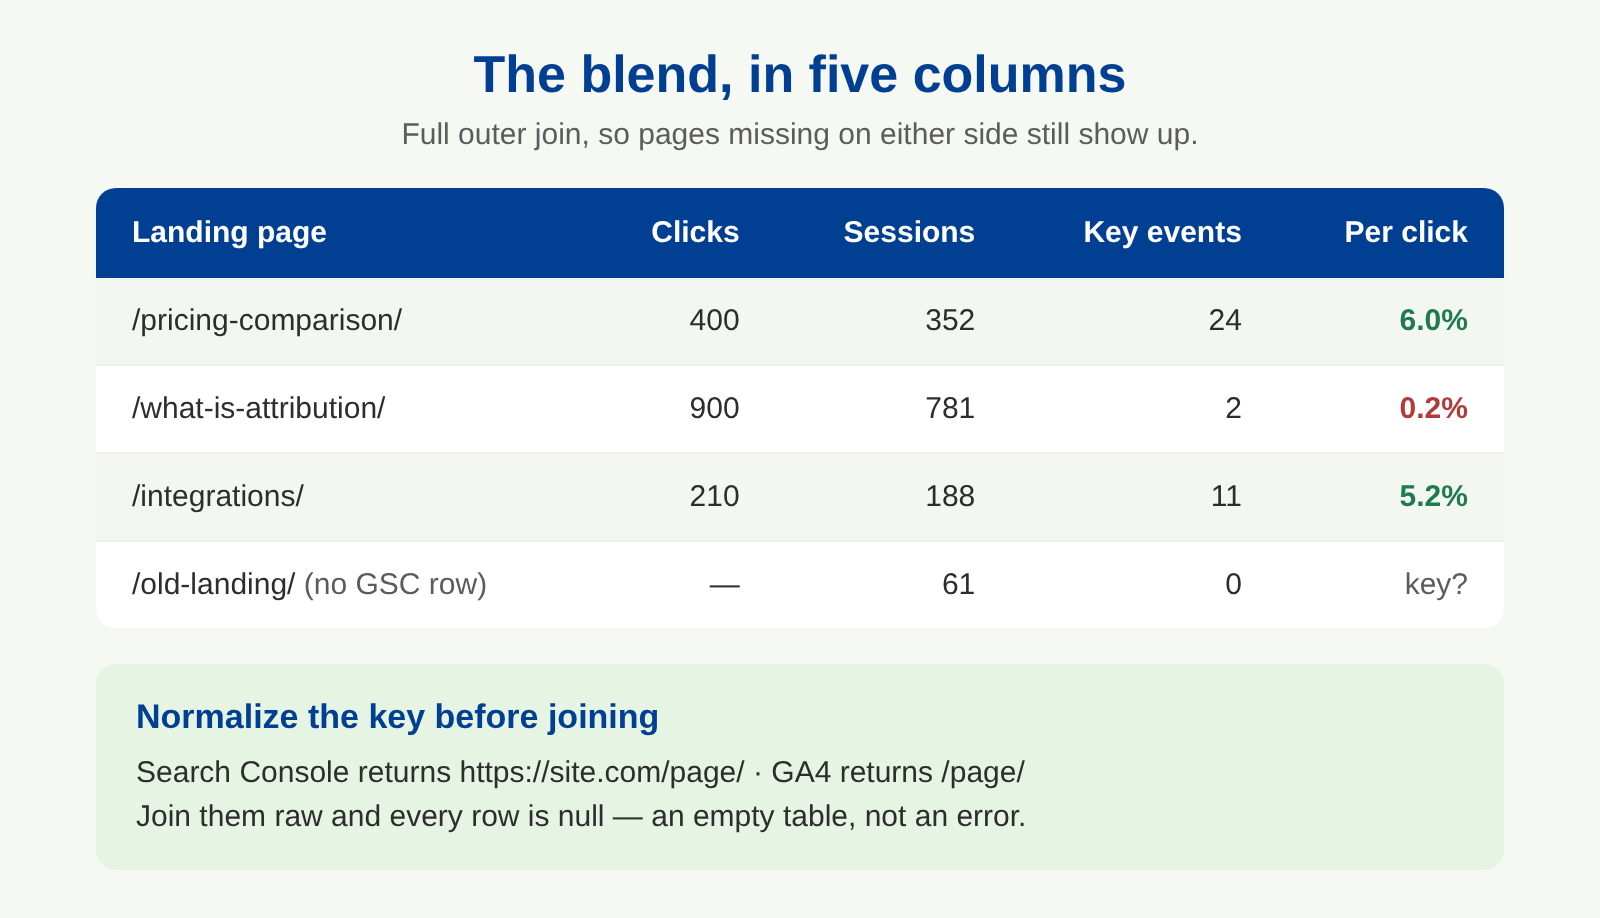
A blend is a join, and Looker Studio will happily build one on a field that looks right and isn’t. The only field the two sources genuinely share is the landing page URL, and even that needs work. Search Console gives you the full URL, protocol and domain included, attributed to whichever URL Google chose as canonical; GA4 gives you the path alone, from the session’s first page view. Join them raw and every row returns null — an empty chart rather than an error, the failure mode that costs people an afternoon.
How do you clean landing page URLs for the join?
Create a calculated field in each data source that reduces the URL to the same shape: lower-case path, no protocol, no host, no query string, no trailing slash. Then join on those two fields.
LOWER(REGEXP_REPLACE(REGEXP_REPLACE(REGEXP_REPLACE(Landing Page, '^https?://[^/]+', ''), '\\?.*$', ''), '/$', ''))GA4 source — new field Join KeyLOWER(REGEXP_REPLACE(REGEXP_REPLACE(Landing page, '\\?.*$', ''), '/$', ''))Reading from the inside out: the first REGEXP_REPLACE strips protocol and host, the second drops everything from ? onward, the third removes the trailing slash so /pricing/ and /pricing land on one row. The homepage becomes an empty string on both sides, which still matches. GA4’s field is already path-only, so the middle replace is a no-op there — I keep it so both formulas read alike.
Should date be part of the join?
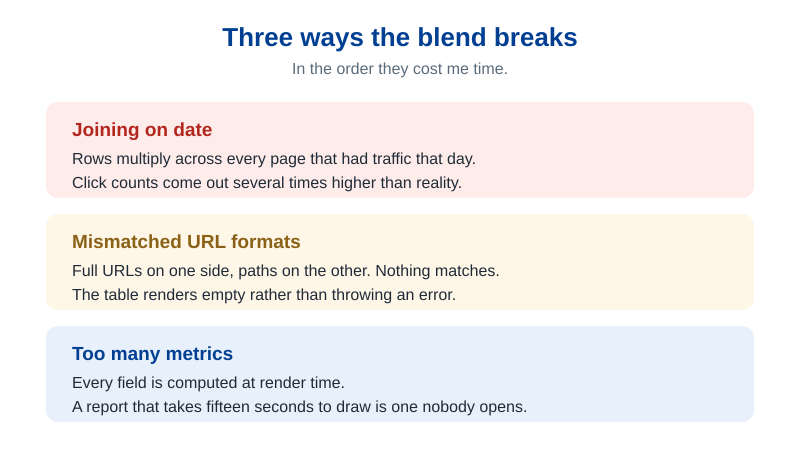
Not on its own, ever. A date-only join seems reasonable and it’s the most common way these reports break: with no page key in the condition, every Search Console row for a day matches every GA4 row for that day, and the click counts come back several times the real figure.
Date inside the blend is fine if you treat it like any other shared dimension — the rule that governs device and country too. A field sitting in both tables has to sit in the join condition as well (Join Key and Date), or each dated row on one side pairs with every dated row on the other and the rows multiply. Put it in one table only and they fan out the same way. Quietest of all: keep date out of both tables and drive the window from a report-level control.
Wiring the two sources together
The mechanics are quick once the key is sorted. This is the sequence I follow now.
Connect the sources. Add both to the report — Search Console (URL Impression, search type web) and GA4 — with the Join Key field already built on each.
Open the blend editor. Resource → Manage blended data → Add a blend. Google’s Search Central post on blending Search Console data in Looker Studio takes the same route with a spreadsheet as the second table; the join setup is identical.
Set up the two tables. Left, Search Console: dimension Join Key, metrics URL Clicks, Impressions, Average Position — nothing else, and in particular no Query dimension. Right, GA4: dimension Join Key, metrics Sessions, Engaged sessions, Key events, plus Total revenue if the client has it, filtered to Session source / medium = google / organic so the GA4 side counts the traffic Search Console reports and not Bing or your newsletter.
Configure the join. Operator: full outer join. Condition: Join Key (Search Console) = Join Key (GA4). Leave Hide repeated join fields ticked so the key shows up once.
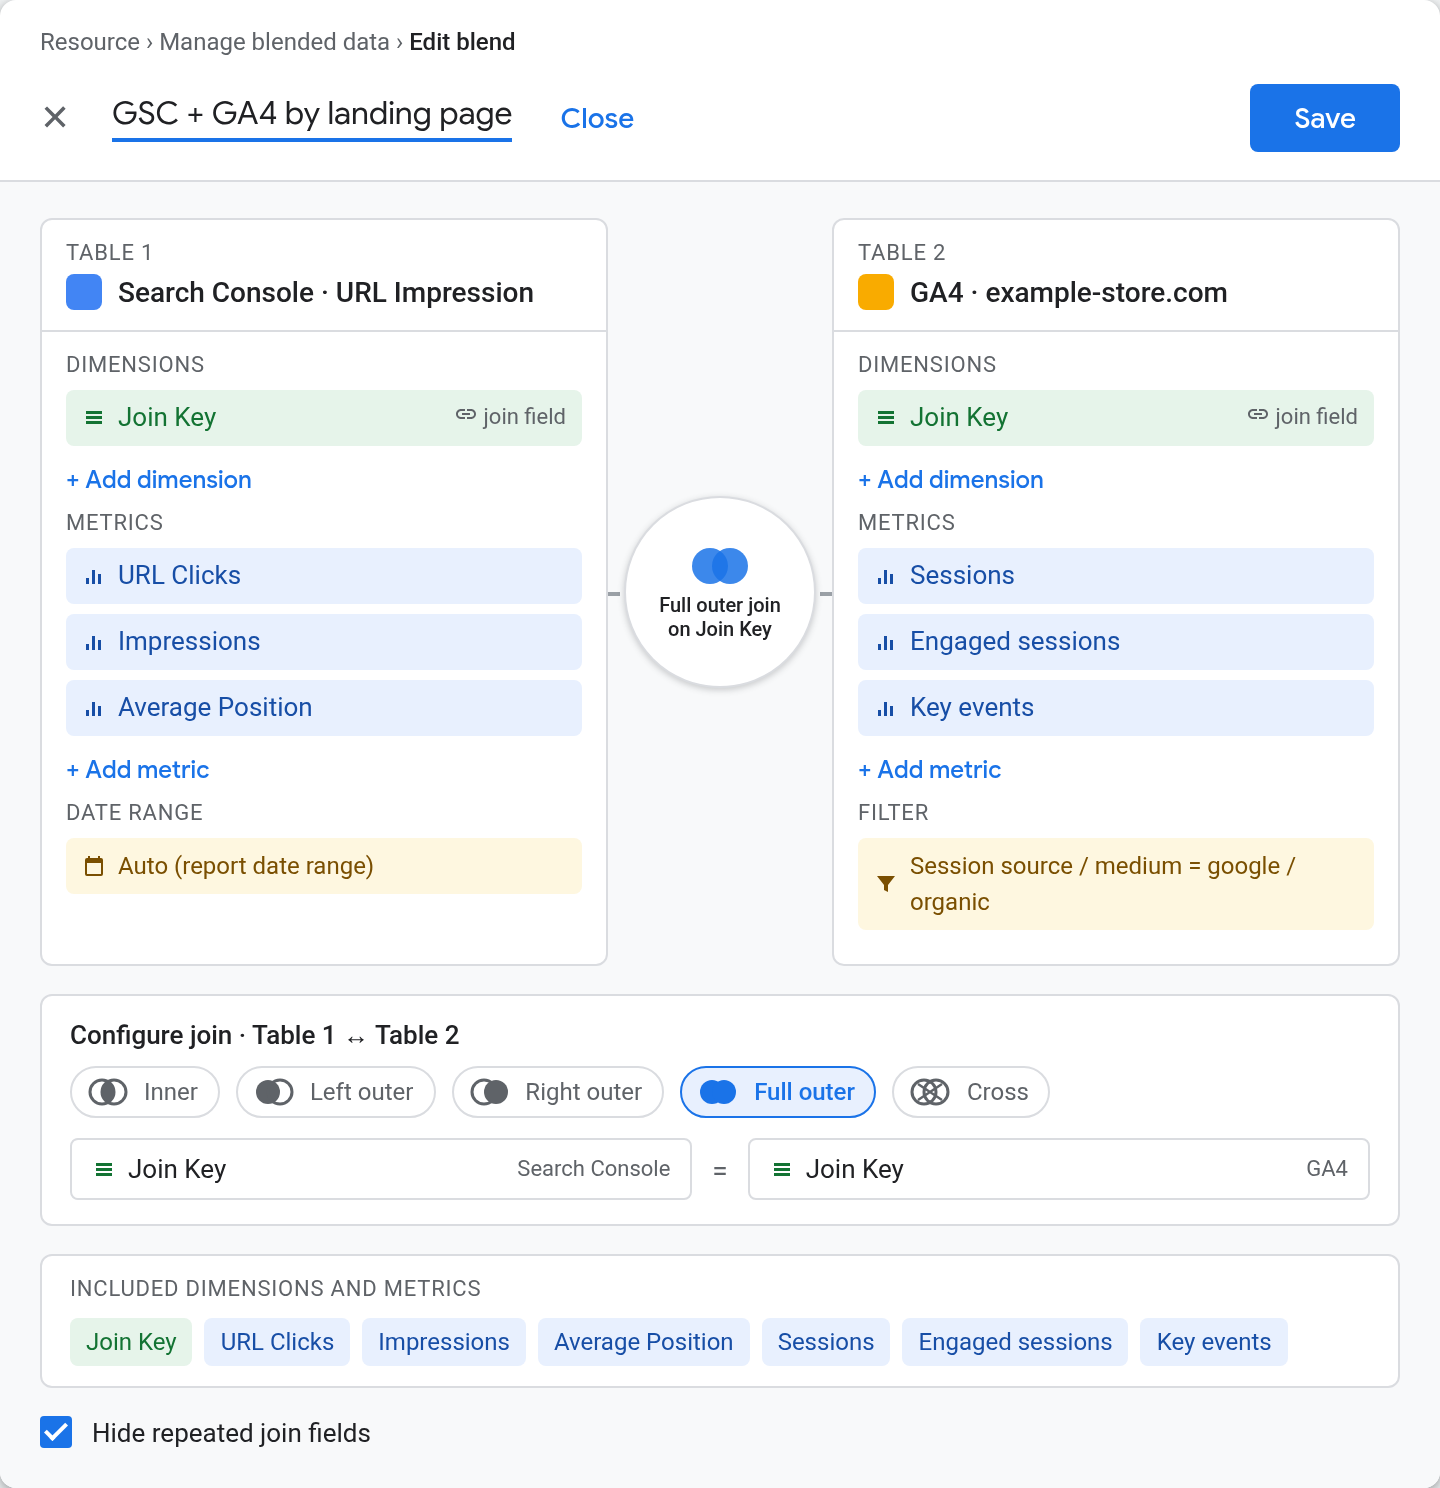
Full outer, not the left outer join most tutorials suggest, because you want the rows that failed to match on either side: a GA4 landing page with organic sessions but no Search Console row is a cleanup problem a left join hides. Narrow to left outer later, for the client-facing table.
Set the date range. A blend has no data freshness or credentials settings of its own — it inherits those from its sources — but the date range is set per table, so a report-level date control is the simplest way to hold both sides to one window.
My default table has five columns: landing page, clicks, sessions, key events, key events per click. Underneath sits a second table from the Search Console source alone — landing page and query, cross-filtering on — so clicking a page filters the queries to it. Everything else I’ve tried adding got removed within a month.
If the report goes beyond the marketing team, add a date-range control and nothing else. Filters look helpful and get misused — I once watched a stakeholder narrow a report to one page and conclude organic traffic had collapsed.
Which metrics and dimensions belong in the blend
Keep the list short. Every extra field slows the report, and a blend that takes fifteen seconds to draw is a blend nobody opens.
Dimensions. Join Key is the only mandatory one, and I relabel it Landing page in the chart. Device category is worth adding when the client cares about mobile — but it goes into both tables and into the join condition, or each Search Console device row picks up the page’s full GA4 sessions and the totals triple. Watch the casing too: if the sources spell the values differently, Mobile won’t match mobile, and a LOWER() wrapper on each side fixes it. Country and Date follow the same rule.
Metrics. URL Clicks, Impressions and Average Position from Search Console; Sessions, Engaged sessions, Key events and Total revenue from GA4. Leave URL CTR and Engagement rate out and recompute them on the chart, for the reason in the next section. If you’re unsure which the dashboard needs, I sorted the candidates in marketing dashboard metrics: what to track and what to cut.
Google’s documentation on how blends work explains why: rows are grouped by each table’s dimensions before the join, and source metrics arrive unaggregated, so you set SUM again on the chart. That pre-grouping is exactly why a Query dimension inflates GA4 numbers.
Calculated fields worth adding
Three formulas earn their place on every blend I ship. Create them on the chart or in the blend, not on the sources.
SUM(URL Clicks) / SUM(Impressions)Sessions per click — the tracking-health ratioSUM(Sessions) / SUM(URL Clicks)Key events per click — what the client is paying forSUM(Key events) / SUM(URL Clicks)Recomputing is the whole point. URL CTR, Engagement rate and Average Position are already ratios at the row level, and re-aggregating one across rows gives an average of averages instead of clicks divided by impressions.
Sessions per click is the one I watch. On the accounts I’ve run it sits between 0.6 and 0.95, and its level matters less than its stability. Weight position by impressions too — SUM(Average Position * Impressions) / SUM(Impressions) — because a plain average lets a page with twelve impressions at position 3 drag down one with twelve thousand at position 18.
Sort by key events per click and the top of the list is content that already converts and deserves more impressions; invert it and you’ve found the pages ranking for the wrong intent.
Why the totals will not match
Once the blend renders, somebody will notice that Search Console clicks and GA4 sessions disagree and ask which one is broken. Neither is. They count different events under different conditions, for five separate reasons.
A click and a session are different events. A click is recorded when someone leaves the results page; a session begins when the tag fires on your site. In between a visitor can hit back, block the script, decline consent, or drop the request — and sessions that lose their attribution land in (not set) or Unassigned rather than organic, covered in how to fix GA4 “(not set)” and unassigned traffic.
Search Console reports the canonical URL, GA4 reports the URL that loaded. A redirect after landing doesn’t change Google’s canonical assignment, so mobile URLs, parameter variants and redirect chains split rows that Search Console keeps together.
The clocks and calendars differ. Search Console reports by day in Pacific time and publishes about two days behind; GA4 uses your property’s time zone and is close to live. So the last two days of any blend show sessions with no clicks — and for a European property, whose day starts eight or nine hours ahead of Pacific, the boundary itself shifts clicks between dates. Compare rolling weeks, not yesterday.
Rare queries are hidden and rows are pre-grouped. Search Console withholds queries made a small number of times, so query-level rows never sum to the page total even inside the GSC data itself. Looker Studio then collapses identical rows within each table before joining. Both effects shrink one side, and neither shows up as an error.
The property boundaries aren’t the same. A Search Console source is one property and one search type; a GA4 stream counts every visit its tag sees, Google Images, News and Discover included. Domain property versus URL-prefix property changes which subdomains are in scope at all.
What I care about is the ratio over time. A stable gap is normal; a widening one means tracking is degrading — a consent banner change, a tag that stopped firing on one template, a redirect that lost a parameter. I note it in the report rather than wait to be asked, the same habit behind my guide to building a marketing report that people actually read.
Mistakes that quietly break the blend
None of these throws an error. Each produces a table that renders and lies, so run the list before you send the link.
- Query in the joined table. Pre-grouping makes one row per page-and-query, then the join hands each of them the page’s full GA4 sessions. I’ve seen a report claim 40,000 organic sessions on a site with 6,000.
- Joining on the raw URL. Full URL on one side, path on the other, nothing matches — and the temptation is to blame the connector. It’s always the key.
- Joining on date alone, or a shared dimension in one table only. Date with no page key pairs every page with every page; a dimension listed on one side but not the other fans its rows across every value opposite. In both tables and the join, or in neither.
- Connecting the Site Impression table. No Landing Page field, so no key. It happens more than you’d think — it’s the connector’s first option.
- Trusting a ratio metric from the source. Recompute CTR, engagement rate and weighted position from the base metrics, as above.
When a blend is the wrong tool
Two situations where I skip it entirely, and three alternatives that cover what a blend can’t.
When the site is small. Under a few hundred organic clicks a month, page-level conversion data is too sparse to read. Three conversions on a page isn’t a 12% conversion rate, it’s three conversions.
When the real question is trend, not attribution. If the client wants to know whether organic is growing, two charts side by side answer that faster and never break. Blends carry a maintenance cost: they fail silently when a URL structure changes.
When is BigQuery, Sheets, or the API better than a blend?
Choose the blend when the audience needs a live report and nobody on the team writes SQL. Choose Google Sheets for a one-off or a monthly snapshot: export both sources, clean the URLs with a formula, match them with a lookup — and accept that it breaks the moment it has to refresh itself. Choose BigQuery when the site is large or the questions are historical: GA4’s native export and Search Console’s bulk data export land both tables in one dataset, the join is a few lines of SQL, and you keep history past Search Console’s 16-month window — my GA4 BigQuery queries walkthrough covers the GA4 half. Choose the APIs when the same join has to run for many properties.
For anything bigger than a brochure site — an ecommerce catalog, a content site with hundreds of ranking pages — the blend earns its keep the first time it shows a high-traffic page converting at nothing.
Frequently asked questions
Can I blend more than two sources?
Looker Studio allows up to five tables from up to five data sources in one blend, and performance degrades quickly with each one. I stop at two for reports that get opened daily. A third source is usually a sign the report is trying to answer two different questions, and splitting it into two pages serves everyone better.
Why is my blended table empty?
Almost always the join key. Search Console returns full URLs and GA4 returns paths, so an unprocessed join matches nothing and renders an empty table rather than an error. Normalize both sides to the same format with a calculated field on each source, and check a single known URL by hand before trusting the whole table.
Does blending slow the report down?
Yes, noticeably. Every blend is computed at render time, so a report with several blends and a wide date range can take many seconds to draw. Cutting the metric list and shortening the default date range fixes most of it; if it’s still slow, the data volume has outgrown Looker Studio’s free connectors.
How do I delete blended data in Looker Studio?
Resource → Manage blended data lists every blend in the report with an edit and a remove action. Charts built on a removed blend lose their source and show an error until you point them at another one, so re-source the charts first if you’re replacing rather than deleting.
How often should the blend be rebuilt?
Check it whenever the site’s URL structure changes, and once a quarter regardless. Matched-row counts drift downward as pages get renamed and redirected, and nothing in the interface tells you that the report is now covering 60% of your traffic instead of 95%. A scorecard on the full outer join that counts rows with null sessions is the cheapest alarm I know.
Where to start
Build the join key first. Everything else is arrangement — the key decides whether the numbers mean anything.
Once it holds, the report answers what no single tool can: which searches bring people who do something. For most of my clients that’s been worth more than every ranking chart I ever built — and the full dashboard this blend lives inside is in my Looker Studio dashboard walkthrough.