
A dashboard shows what happened. A marketing report explains what it means and what to do about it. That gap — between data and decision — is where most reports fail. They’re a pile of screenshots with no story, and the executive reading them is left to connect the dots alone. Usually they don’t bother.
I’ve written hundreds of these. The reports that earned budget weren’t the ones with the most charts. They were the ones that opened with a clear verdict — “good month, here’s why, here’s what’s next” — and used data to back it up. A report is an argument, not an archive.
This guide shows you how to build a marketing report that people actually read and act on: the structure that works, how to turn metrics into a narrative, what to cut, and how to end with recommendations instead of trailing off into a wall of numbers. Whether it’s a weekly check-in or a quarterly review, the principles are the same.
Table of Contents
Report vs. Dashboard: Know the Difference
People use these words interchangeably, but they do different jobs. A dashboard is a live, self-serve screen for monitoring — you glance at it whenever you want the current state. A report is a periodic, curated narrative — you sit down and read it because someone has done the thinking for you.
The dashboard answers “what’s happening right now?” The report answers “what happened, why, and what should we do?” If your report is just a static snapshot of your dashboard, you’ve skipped the part that makes a report valuable: the interpretation.
A dashboard is for monitoring; a report is for deciding. If your report contains no judgment — only numbers — it’s a dashboard screenshot wearing a report’s clothes.
Step 1 — Start With the Audience
Before you pull a single number, ask who’s reading and what they need to decide. The same data becomes three different reports depending on the audience.
| Audience | They want | Report length |
|---|---|---|
| Executive / CEO | The verdict, the bottom line, the ask | One page or less |
| Marketing lead | Channel performance, what’s working, trade-offs | 2–4 pages |
| Specialist / analyst | Granular detail, segments, raw data | As long as needed |
The most common reporting mistake is writing one report for everyone. The executive drowns in detail; the analyst is starved of it. When I report to mixed audiences, I lead with a one-page executive summary and append the detail behind it. Each reader stops where their need ends.
Step 2 — Lead With the Verdict
Journalists call it “don’t bury the lede.” Your report should open with the conclusion, not build to it. The first thing a reader sees should answer: was this a good period or not, and why?
A strong opening looks like this: “Strong month. Organic traffic grew 18% and conversions rose 12%, driven by three new pillar pages. Paid efficiency slipped — CPA up 22% — so we’re reallocating budget. Recommendation: hold paid flat, double down on content.” Four sentences, and the executive already knows the story.
If a reader stopped after your first paragraph, would they know whether to be happy? If not, you’ve buried the lede. Put the verdict first.
Everything after the opening exists to support that verdict. The charts, the tables, the segment breakdowns — they’re evidence for the claim you’ve already made, not a slow reveal toward it.
Step 3 — Use a Repeatable Structure
A consistent structure makes reports faster to write and faster to read. Readers learn where to find things. Here’s the skeleton I use for nearly every recurring marketing report:
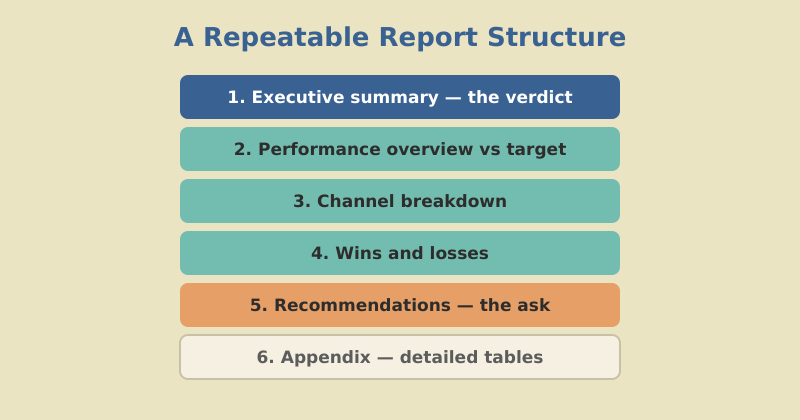
- Executive summary — the verdict and the headline numbers, one paragraph.
- Performance overview — the key metrics versus last period and versus target.
- Channel breakdown — how each channel contributed, what moved.
- Wins and losses — two or three things that worked, two or three that didn’t.
- Recommendations — what to do next period, prioritized.
- Appendix — detailed tables for anyone who wants to dig.
Reuse this every period and reporting stops being a blank-page ordeal. You’re filling in a known template, and your readers always know where the recommendation lives.
Step 4 — Turn Metrics Into Narrative
This is the skill that separates a report from a data dump. Every metric you include should answer the reader’s silent question: so what? A number with no interpretation forces the reader to do your job.
Compare these two ways of presenting the same fact:
- Data dump: “Organic sessions: 14,200 (up from 12,000).”
- Narrative: “Organic sessions grew 18% to 14,200, driven mostly by the new comparison guides, which now rank on page one for three target terms. This is the second straight month of double-digit organic growth.”
The second version tells the reader what happened, why, and whether it’s a trend. That context is what makes a report worth reading. Tie your metrics back to the work that drove them — campaigns, content, experiments — so the report reads as cause and effect, not a list of disconnected numbers. The same storytelling discipline underpins how you measure content marketing ROI in the first place.
Data is just a pile of facts until someone gives it a plot. The reporter’s job isn’t to present numbers — it’s to tell the story those numbers add up to, and to be honest when the story isn’t flattering.
Digital Marketing Specialist, mousaw.com
Step 5 — End With Recommendations
A report that ends with numbers ends with a shrug. A report that ends with recommendations ends with momentum. The final section should answer: given all this, what do we do next?
Make recommendations specific and prioritized. Not “improve SEO” but “publish three comparison guides targeting the high-intent terms we’re ranking 8–15 for — expected to lift qualified traffic next quarter.” Tie each recommendation to a metric in the report so the logic is visible. Limit yourself to the top three; a report with fifteen recommendations has none.
This is also where you ask for what you need — budget, headcount, a decision. The report you’ve built is the argument; the recommendation is the ask. A clear SEO strategy for the next period belongs right here, framed as a choice the reader can approve.
Common Mistakes to Avoid
The patterns I see sink reports over and over:
- No verdict. The report presents data and lets the reader guess whether it’s good. Always state the conclusion.
- Screenshot soup. Pasting dashboard images with no interpretation. A report is words plus data, not data alone.
- Hiding bad news. Burying a 30% drop in an appendix destroys trust. Be honest — it’s what makes the wins credible.
- Cherry-picked time frames. Comparing to a weak month to look good. Use consistent periods every time.
- No recommendations. Ending on numbers instead of next steps. The “so what” is the whole point.
Avoid these and your report graduates from a chore nobody reads into a document that drives decisions — and protects your budget.
Frequently Asked Questions
Reports That Earn Their Read
A great marketing report respects the reader’s time by doing the thinking for them. It opens with a verdict, structures the evidence predictably, turns every metric into narrative, and closes with a clear ask. The numbers are necessary, but the interpretation is what makes it valuable.
Start your next report with one sentence: was this a good period, and why? Write that first, then assemble the data that proves it. End with the three things you’d do next. If you can do those two things — lead with the verdict, close with the recommendation — you’re already ahead of most reports that land on an executive’s desk.
The goal isn’t to report more. It’s to report better — to turn the pile of numbers your tools produce into a decision someone can confidently make. That translation, from data to direction, is the entire job.