In This Guide
- What Is a SaaS Growth Strategy?
- Choosing Your Growth Motion: PLG vs. Sales-Led vs. Hybrid
- How Product-Led Growth Actually Works
- The Retention Engine: Churn, GRR, and NRR
- Expansion Revenue: Engineering Growth from Within
- Stage-by-Stage Growth Priorities
- Measuring Growth Efficiency
- Frequently Asked Questions
Most SaaS growth advice reads like a buffet menu: try PLG, add referrals, optimize pricing, invest in content. But without knowing when each strategy matters — and in what order — you end up doing everything and excelling at nothing.
The gap between high-performers and the rest isn’t about knowing more tactics — it’s about sequencing them correctly. According to Precedence Research, the SaaS market is growing at nearly 13% annually, yet SaaS Capital’s benchmark data shows most private companies trail far behind the market’s potential.
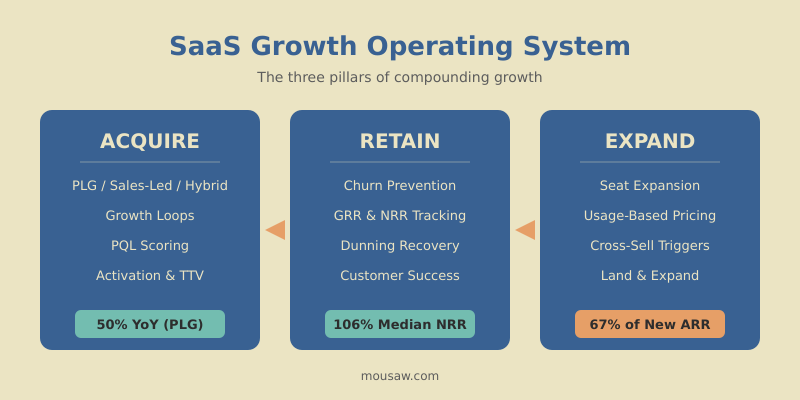
This guide is a SaaS growth strategy operating system. I’ll walk you through the three pillars that drive compounding growth — acquisition mechanics, retention engineering, and expansion revenue — with real benchmarks, specific company examples, and a stage-by-stage framework you can apply today.
The only way to build a $100 billion company is to make something that a lot of people use every day.
Founder & CEO, Salesforce
What Is a SaaS Growth Strategy?
A SaaS growth strategy is the system a software company uses to acquire, retain, and expand its customer base in a way that compounds over time. It’s not a marketing plan or a sales playbook — it’s the operating logic that connects product, go-to-market, and customer success into a single growth engine.
The difference between a strategy and a collection of tactics comes down to one question: does each action feed the next? When a new user signs up, tries the product, invites a colleague, and eventually upgrades — that’s a growth loop. When you run ads, close deals, and pray they don’t churn — that’s a leaky funnel.
Modern SaaS growth strategies share three characteristics:
- They’re compounding, not linear. Growth loops (referral, collaboration, content) generate output that becomes new input. Dropbox’s referral program drove 35% of all new daily signups — each new user fueled more acquisition.
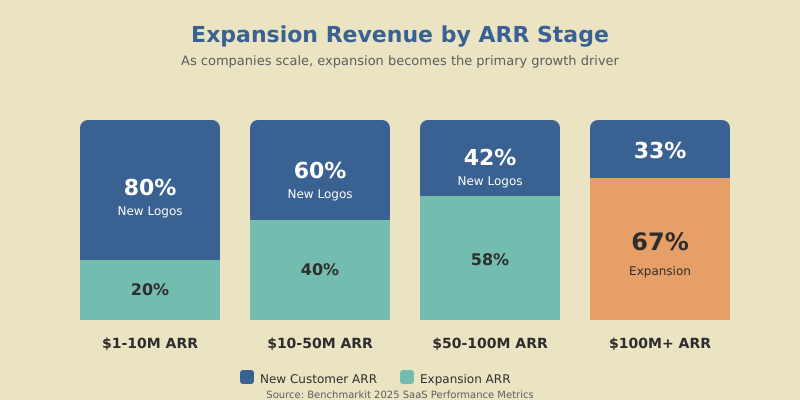
- They shift revenue gravity toward expansion. For SaaS companies above $100M ARR, expansion revenue accounts for 67% of new ARR. The best companies don’t just acquire — they grow within.
- They match the growth motion to the product. A $5/month tool and a $100K/year platform require fundamentally different strategies. Trying to force enterprise sales on a self-serve product (or vice versa) is the most common mistake I see.
A growth strategy is a system, not a checklist. Each action should generate output that feeds the next — that’s what separates growth loops from leaky funnels.
Choosing Your Growth Motion: PLG vs. Sales-Led vs. Hybrid
Before you can build a growth strategy, you need to decide how your product reaches customers. This is your growth motion, and getting it wrong is expensive.
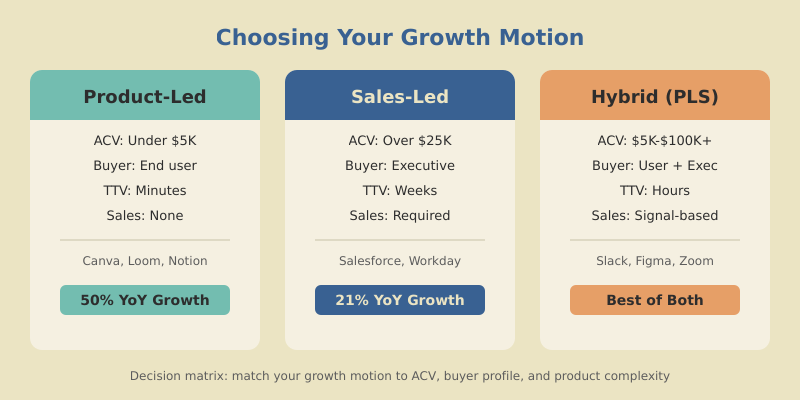
There are three models, and each fits different products:
| Factor | Product-Led (PLG) | Sales-Led (SLG) | Hybrid (PLG + Sales) |
|---|---|---|---|
| ACV | Under $5K/year | Over $25K/year | $5K-$100K+/year |
| Buyer | End user | Executive / committee | User adopts, exec buys |
| Time to value | Minutes to hours | Weeks to months | Hours to days |
| Sales involvement | None or minimal | Required from start | Triggered by usage signals |
| Examples | Canva, Loom, Notion | Salesforce, Workday | Slack, Figma, Zoom |
Product-Led Growth means the product itself drives acquisition, activation, and expansion. The user experiences value before talking to anyone. PLG companies grow at a median 50% year-over-year, compared to 21% for traditional sales-led companies. Their enterprise values are 2x higher than the public SaaS index.
Sales-Led Growth works when the product is complex, the deal size is large, and the buyer needs education before committing. It’s not dead — it’s just not the default anymore.
Hybrid (Product-Led Sales) is where most successful SaaS companies end up. Slack, Zoom, and Figma all started as pure PLG and layered sales once they saw enterprise adoption signals. The key is knowing when to add sales — and that moment comes when you see teams of 10+ users organically adopting but struggling to get company-wide buy-in.
Every interaction a customer has with a product is an opportunity to deliver value. In PLG, the product is the salesperson, the onboarding specialist, and the success manager — all at once.
Author of “Product-Led Growth,” Founder of ProductLed
If a new user can reach their “aha moment” in under 30 minutes without help, start with PLG. If your product requires implementation or executive buy-in, start sales-led. Default to PLG when unsure — you can layer sales later, but you can’t easily inject product-led DNA into a sales-driven culture.
How Product-Led Growth Actually Works
PLG isn’t “let users sign up for free and hope they pay.” It’s a system with specific mechanics that either compound or collapse depending on execution. Let me break down the four components that matter.
Activation: The Make-or-Break Metric
Activation is the moment a user first experiences the value they signed up for. For Slack, it’s sending the first message in a team channel. For Canva, it’s completing a first design. For Loom, it’s recording and sharing a first video. According to Agile Growth Labs’ 2025 benchmark report, nearly two-thirds of new signups never reach this moment — and UserGuiding’s onboarding research shows 75% of those users churn within the first week.
Yet ProductLed’s benchmark study found that only 34% of SaaS companies formally track activation rate. If you measure nothing else in PLG, measure this. What moves the needle:
- Reduce time to value (TTV). The average SaaS TTV is 1 day, 12 hours, 23 minutes. Top performers get it under 5 minutes. Every extra step in your onboarding flow costs you users.
- Build a “quick win” into onboarding. Products with an early success moment retain 80% more users. Don’t show all features — show the one that solves the problem they signed up for.
- Use interactive onboarding. Interactive flows drive 50% higher activation than static tutorials or video walkthroughs.
Conversion: Freemium vs. Free Trial
Two models, very different economics:
| Model | Median Conversion | Top Performers | Best For |
|---|---|---|---|
| Freemium | 2-5% | 5-10% | Viral products, network effects, broad TAM |
| Free Trial (opt-in) | 18-25% | 30%+ | Clear value prop, higher ACV |
| Free Trial (opt-out) | 49-60% | 65%+ | Sticky products, high switching cost |
According to First Page Sage’s conversion benchmarks, free trials convert 5-10x better than freemium. But freemium builds a much larger top of funnel, which matters for products with viral loops. Dropbox’s freemium-with-referral combination drove 3,900% user growth in 15 months — the 2-5% conversion rate was fine because the volume was massive.
Choose freemium when your product has network effects or collaboration mechanics. Choose free trials when the value is clear and the buying decision is straightforward.
Product Qualified Leads (PQLs)
Here’s the biggest missed opportunity in PLG: only 24% of PLG companies use Product Qualified Leads. Yet PQLs convert to paid at 25% — nearly 3x the rate of traditional marketing qualified leads.
A PQL is a user who has demonstrated buying intent through product behavior: hitting a usage limit, inviting team members, using premium features during a trial, or reaching a specific activation milestone.
The shift from MQL to PQL thinking changes everything about your funnel. Instead of scoring leads based on content downloads and website visits, you score them based on what they actually do in your product. When I helped a B2B SaaS team implement PQL scoring, their sales team stopped chasing cold leads and started having conversations with users who had already experienced value. Close rates jumped from 8% to 22%.
PQLs convert at 25% vs. ~9% for traditional MQLs — yet 76% of PLG companies still don’t use them. Implementing PQL scoring is probably the highest-leverage move you can make in your sales funnel today.
Growth Loops: Beyond the Linear Funnel
The traditional AARRR funnel (Acquisition, Activation, Retention, Revenue, Referral) treats growth as linear. Growth loops treat it as circular: each step’s output feeds back into acquisition.
Three types of growth loops that work in SaaS:
- Viral loop: User invites colleague → colleague signs up → colleague invites others. Calendly’s scheduling link is the product and the distribution — every meeting invite is a growth event that took them from $70M to $270M+ ARR with minimal paid advertising.
- Content loop: Users create content in the product → content is shared publicly → viewers become users. Notion templates, Canva designs, and Figma community files all drive organic acquisition.
- Data network effect: More users → better product (recommendations, integrations, benchmarks) → more users. This is slower to build but creates the deepest moat.
Growth is not about one silver bullet. It’s about building a system of compounding advantages — a flywheel where every rotation makes the next one easier.
Former VP of Growth at HubSpot, CEO of Reforge
The Retention Engine: Churn, GRR, and NRR by the Numbers
Acquisition without retention is a leaky bucket. And in SaaS, even small improvements in retention compound dramatically over time. Here are the benchmarks you need to know.
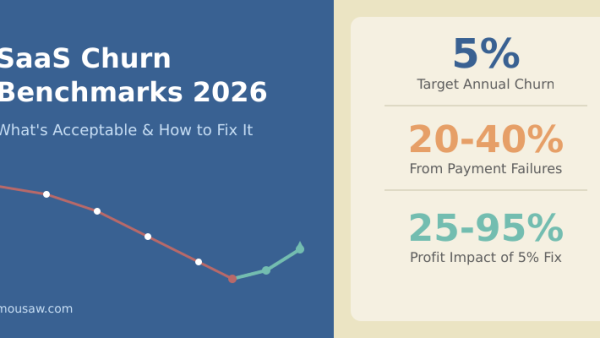
Churn Benchmarks That Actually Matter
The average B2B SaaS monthly churn rate is 3.5%. But that number hides important details:
| Segment | Monthly Churn | Annual Churn | Benchmark |
|---|---|---|---|
| SMB | 3-5% | 31-46% | Under 3% monthly = good |
| Mid-Market | 1.5-3% | 17-31% | Under 2% monthly = good |
| Enterprise | 0.5-1.5% | 6-17% | Under 1% monthly = good |
The distinction between voluntary churn (customer decides to leave — 2.6% average) and involuntary churn (failed payments — 0.8% average) matters because they require completely different solutions. Involuntary churn accounts for 20-40% of total churn and is largely preventable.
Companies using intelligent dunning and retry logic recover 68% of failed payments, compared to just 23% for those that attempt a single retry. If you haven’t optimized your payment recovery, you’re leaving the easiest retention wins on the table.
GRR vs. NRR: Two Sides of Retention
Gross Revenue Retention (GRR) measures what you keep without any expansion. It’s your churn reality check. The median GRR across SaaS is 90%. If yours is below 85%, you have a product-market fit or customer success problem that no amount of expansion revenue can mask.
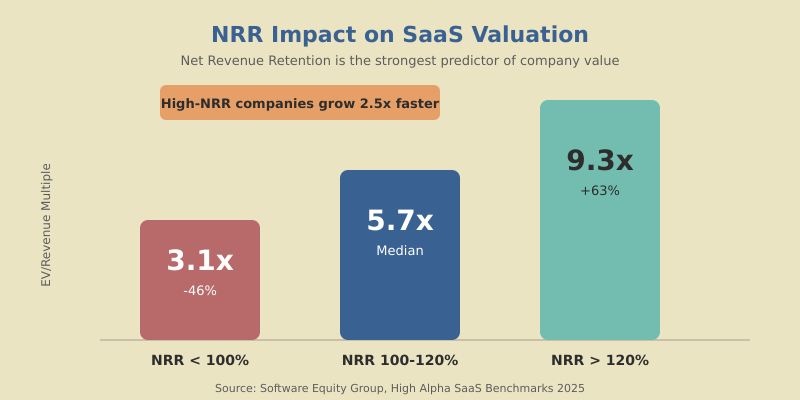
Net Revenue Retention (NRR) includes expansion (upsells, cross-sells, seat additions). The median NRR for B2B SaaS is 106%, with top-quartile companies hitting 115-125%.
Why does NRR matter so much? Because it’s the single strongest predictor of SaaS valuation:
(-46% vs. median)
(NRR 100-120%)
(+63% vs. median)
NRR above 100% means your existing customers generate more revenue each year even if you acquire zero new ones. That’s the compounding engine every SaaS company should build toward.
The most underappreciated growth strategy in SaaS is making your existing customers more successful. NRR is the ultimate proof that you’re doing this well.
Managing Director at Theory Ventures, former Partner at Redpoint
NRR Benchmarks by Company Size
| ARR Range | Median NRR | Median GRR | Target |
|---|---|---|---|
| $1M – $10M | 98% | 85% | Get above 100% |
| $10M – $50M | 105% | 90% | Push toward 115% |
| $50M – $100M | 110% | 92% | Target 120%+ |
| $100M+ | 115% | 94% | Best-in-class: 130%+ |
These benchmarks draw from High Alpha’s SaaS Benchmarks and SaaS Capital’s retention research. If your NRR is below 100% at any stage, fix retention before investing more in acquisition. Pouring users into a leaky bucket doesn’t scale — it accelerates your burn rate.
Expansion Revenue: Engineering Growth from Within
Here’s the number that changes how you think about growth: for SaaS companies above $100M ARR, 67% of new ARR comes from expansion revenue, not new customers. At the $50M-$100M range, it’s 58%.
Expansion isn’t something that “happens” — it’s engineered. Here are the four mechanics that drive it.
Seat Expansion
The simplest form of expansion: more people at the same company use your product. This is the engine behind Slack’s growth from 15,000 to 500,000 daily active users in a single year. One person signs up, their team follows, then adjacent teams, then the whole organization.
To engineer seat expansion, build features that are better with more users: shared workspaces, @mentions, collaborative editing, team dashboards. Then make adding users frictionless — ideally one click.
Usage-Based Expansion
Usage-based pricing is the fastest-growing model in SaaS: 85% of companies are either using it or actively testing it, and 46% take a hybrid approach (base subscription plus usage-based components).
The appeal is alignment: customers pay more when they get more value. This naturally drives NRR above 100% without requiring sales conversations. But it requires careful design — customers need predictable bills, so cap-and-overage or committed-usage models work better than pure metering for most B2B products.
Cross-Sell and Upsell Triggers
The most effective expansion happens when it’s triggered by product usage signals, not sales calendar events. Build triggers around:
- Feature gates: User hits a limit on their current plan — show an upgrade prompt with the specific value they’ll unlock
- Usage milestones: Team reaches 80% of seat allocation — alert the admin with a one-click expansion offer
- Engagement signals: Power users regularly visiting premium feature pages — trigger a targeted upgrade email
HubSpot’s land-and-expand model is the textbook example: teams buy one hub (Marketing, Sales, or Service), realize value, then expand to adjacent hubs. Each expansion increases switching costs and deepens the relationship.
Customer Success-Driven Expansion
For mid-market and enterprise accounts, customer success teams drive expansion through structured programs:
- Quarterly Business Reviews (QBRs): Review usage data, identify underutilized features, and map expansion to business outcomes
- Health scoring: Track product usage, support tickets, and engagement to identify accounts ready for expansion (or at risk of churn)
- Executive alignment: Connect your product’s impact to the customer’s OKRs — expansion sells itself when tied to their goals
Customer success is where 90% of the revenue is. Acquiring a customer is just the beginning — the real growth happens after the first sale.
Founder of SaaStr, Former CEO of EchoSign
Stage-by-Stage Growth Priorities
Not every strategy applies at every stage. Here’s what to focus on based on where you are.
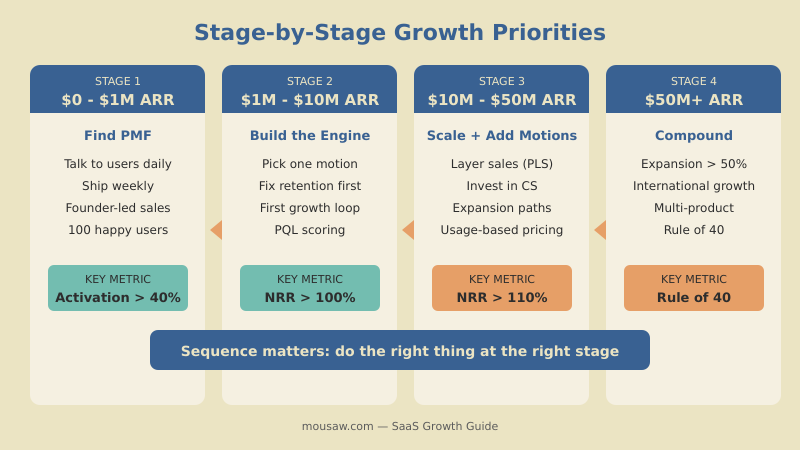
Priority: Validate that people want what you’re building — and will pay for it.
- Talk to users daily. Ship weekly. Measure activation, not vanity metrics.
- Your growth motion should be whatever gets you the fastest feedback loop — usually founder-led sales or a tight beta community.
- Don’t invest in scalable acquisition channels yet. Get 100 customers who love the product first.
Priority: Establish a repeatable acquisition channel and fix retention.
- Choose your primary growth motion (PLG or sales-led) and go deep — don’t split resources across both.
- Get GRR above 85% and NRR above 100%. If churn is high, that’s your problem — not lead volume.
- Build your first growth loop. Calendly, Loom, and Figma all hit $10M ARR primarily through organic viral loops.
- Implement PQL scoring if you’re PLG. Start measuring CAC payback period — target under 12 months.
Priority: Scale what works, add a second growth motion, and shift toward expansion revenue.
- If you’re PLG, this is when to layer sales (Product-Led Sales). Target teams of 10+ organic users as enterprise expansion opportunities.
- Invest in customer success. Companies with dedicated CS teams achieve 91% revenue retention vs. 75% without.
- Build expansion revenue mechanics: usage-based components, cross-sell paths, QBR programs.
Priority: Make expansion your primary growth driver and optimize for capital efficiency.
- Expansion revenue should exceed 50% of new ARR. The best companies at this stage grow primarily from within their customer base.
- Diversify acquisition channels — international expansion, partnerships, multi-product strategy.
- Optimize for the Rule of 40 (growth rate + profit margin ≥ 40%). Only 17% of public SaaS companies hit this bar, but those that do command 2-3x higher valuation multiples.
- Watch ARR per employee ($150K-$250K benchmark) as a signal of operational leverage.
Measuring Growth Efficiency
Revenue growth alone doesn’t tell the full story. The metrics that separate sustainable growth from cash-burning sprints are efficiency metrics. Here are the four that matter most.
Median public SaaS: just 12%
Below 3:1 = unsustainable
Under 1.5x = efficient
Rule of 40
Growth rate plus profit margin should equal at least 40. A company growing at 30% with 10% margins scores 40 — the same as one growing at 60% with -20% margins. The median public SaaS company scores just 12%. Companies above 40 command 2-3x higher EV/ARR multiples.
CAC Payback Period
How many months does it take to recover the cost of acquiring a customer? Benchmarks vary by segment:
- SMB: 8-12 months (target under 12)
- Mid-market: 14-18 months (target under 18)
- Enterprise: 18-24 months (acceptable given higher LTV)
If your payback period exceeds these ranges, you’re either spending too much on acquisition or your pricing is too low. The median LTV:CAC ratio across B2B SaaS is 3.2:1 — anything below 3:1 signals unsustainable unit economics.
Burn Multiple
Net burn divided by net new ARR. The median for Series A SaaS startups is 1.6x in 2025 — meaning you spend $1.60 to generate $1 of new ARR. Under 1.5x is efficient. Under 1x is exceptional. Above 2x means you’re burning cash faster than you’re building value.
Magic Number
Quarterly new ARR divided by previous quarter’s sales and marketing spend. Above 1.0 means your go-to-market engine is efficient — you’re generating more than a dollar of ARR for every dollar spent. Below 0.5 means your acquisition channels need serious optimization before you scale them.
Efficient growth is not about spending less — it’s about generating more output per unit of input. The companies that win aren’t the ones who raise the most money; they’re the ones who convert capital into durable revenue most effectively.
Co-Founder of Craft Ventures, Former COO of PayPal
Frequently Asked Questions
Building Your SaaS Growth Operating System
SaaS growth isn’t about picking the right tactic — it’s about building a system where acquisition, retention, and expansion reinforce each other. The companies that win don’t grow linearly. They engineer compounding loops: users who activate become advocates who drive acquisition, while existing customers expand their usage and become the primary source of new revenue.
Find product-market fit → Build a repeatable engine → Scale it → Shift gravity from new logos to expansion. Measure activation early, NRR always, efficiency as you scale.
The data is clear: SaaS companies with high NRR grow 2.5x faster, command premium valuations, and create more durable businesses. The path to getting there is the same system described in this guide — choose your motion, activate your users, retain your customers, and expand from within.