SaaS Churn Rate Benchmarks 2026: What’s Acceptable and How to Fix It
When I audited churn for a B2B SaaS client last year, their headline number was 4% monthly — well within “acceptable” range. But when we separated logo churn from revenue churn, we found they were losing 40% of SMB accounts annually while enterprise accounts masked the damage. That single insight changed their entire retention strategy.
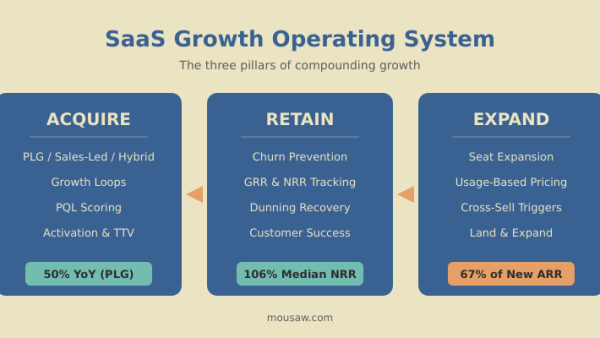
If you’re running a SaaS business, you already know churn is the silent killer. But the question I hear most often isn’t what is churn — it’s what should mine be? Understanding saas churn rate benchmarks is the first step toward building a retention machine that actually works. And if you’re thinking about churn in the broader context of SaaS growth strategy, getting this number right is foundational.
In this guide, I’ll break down the real benchmarks by company stage, pricing tier, and segment — then give you six battle-tested strategies to bring your number down. No fluff, just data and tactics.
What You’ll Learn
- What Churn Actually Measures (And Why Most Teams Track It Wrong)
- SaaS Churn Rate Benchmarks by Company Stage
- Churn Benchmarks by Pricing Tier and ARPU
- The Hidden Churn Problem: Involuntary Churn
- Six Proven Strategies to Reduce SaaS Churn
- How to Calculate Your Churn Rate (Formulas)
- Frequently Asked Questions
What Churn Actually Measures (And Why Most Teams Track It Wrong)
Churn seems simple: customers leave, revenue drops. But there are at least four different ways to measure it, and most teams conflate them into one misleading metric. Let me untangle the definitions that matter.
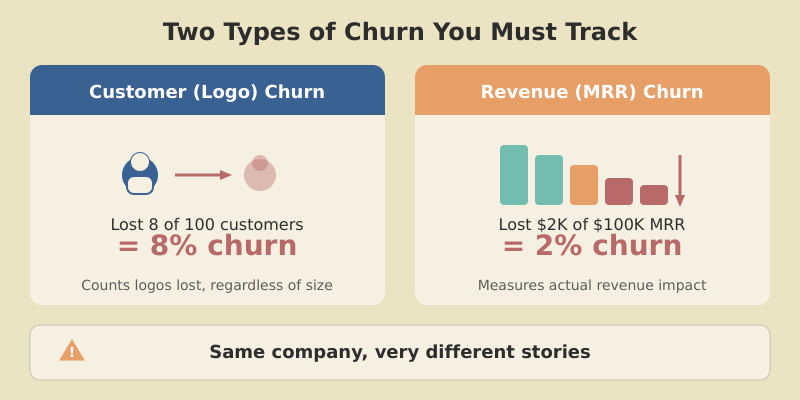
Customer Churn vs Revenue Churn
Customer churn (also called logo churn) measures the percentage of accounts that cancel during a given period. If you start the month with 200 customers and 10 leave, your monthly customer churn is 5%.
Revenue churn (also called MRR churn) measures the percentage of recurring revenue lost from cancellations and downgrades. This is where it gets interesting — and where the gap between the two numbers tells a critical story.
Here’s a scenario I’ve seen repeatedly: a company reports 2% monthly MRR churn, which sounds healthy. But their logo churn is 8% because the accounts leaving are mostly small plans. Those small accounts are your growth pipeline — lose them, and you’re left with a shrinking pool of large accounts with no bottom-of-funnel feeding upward.
Gross Churn vs Net Churn
Gross churn counts only what you lost — cancellations plus downgrades. It’s the raw damage number.
Net churn (or net revenue churn) subtracts expansion revenue — upsells, cross-sells, and seat additions — from the gross number. This is where you can actually go negative, which is the holy grail of SaaS metrics.
A company with 5% gross MRR churn but 7% expansion revenue has net negative churn of -2%. Their existing customer base is actually growing without acquiring a single new account. That’s the power of a well-designed SaaS growth engine.
Net revenue retention (NRR) is the inverse view of this same metric. An NRR of 110%+ means your installed base is expanding faster than it’s contracting. I’ll mention this more later — it’s an important concept that deserves its own deep dive.
Churn is the single most important metric for a subscription business. You can acquire all the customers in the world, but if your bucket is leaking, you’re just pouring water into a sieve.
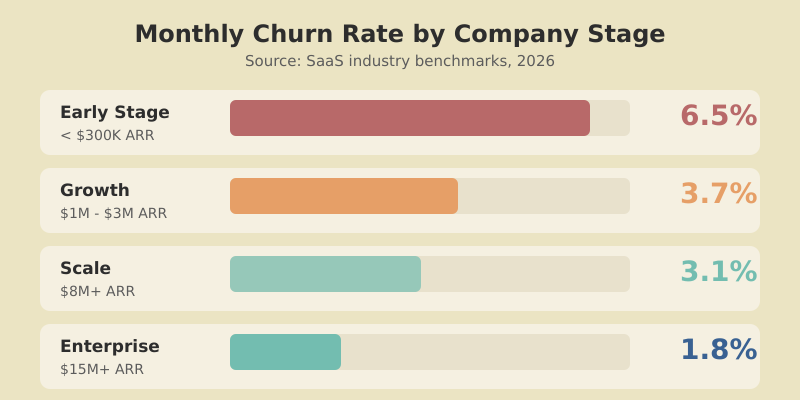
SaaS Churn Rate Benchmarks by Company Stage
Benchmarks only help if they match your context. Here’s what the data shows when you segment by ARR stage, drawn from Recurly’s churn benchmark research and Paddle’s aggregated billing data.
Early Stage (<$300K ARR)
Growth ($1M–$3M ARR)
Scale ($8M+ ARR)
Enterprise ($15M+ ARR)
Let me put this into a more detailed breakdown.
| Company Stage | ARR Range | Avg Monthly Customer Churn | Annual Equivalent | Context |
|---|---|---|---|---|
| Early-Stage / Seed | <$300K | ~6.5% | ~55% | Still finding product-market fit; churn is a feature, not a bug |
| Growth | $1M–$3M | ~3.7% | ~36% | Product-market fit established; retention becomes a priority |
| Scale | $8M+ | ~3.1% | ~31% | Customer success team in place; expansion revenue kicks in |
| Enterprise | $15M+ | ~1.8% (net MRR) | ~20% (net MRR) | Annual contracts, dedicated CSMs, negative net churn common |
Early-stage churn looks terrifying annualized — 55% means replacing more than half your base every year. But this is normal while iterating on product. The real warning sign isn’t high churn itself; it’s no improvement quarter over quarter.
The benchmark that matters most isn’t a static number — it’s the direction. If your churn rate isn’t declining each quarter as you invest in retention, you have a structural problem, not a maturity problem.
Logo Churn Benchmarks by Customer Segment
Since different customer segments have fundamentally different behaviors, here’s how to evaluate your logo churn by the type of customer you serve.
| Segment | Excellent | Good | Acceptable | Needs Attention |
|---|---|---|---|---|
| SMB (self-serve) | <3% monthly | 3–5% | 5–7% | >7% |
| Mid-Market | <2% monthly | 2–3% | 3–5% | >5% |
| Enterprise | <1% monthly | 1–2% | 2–3% | >3% |
Here’s a visual of how churn impact scales at different monthly rates.
21.5% Annual
34.6% Annual
46.0% Annual
58.0% Annual
Churn Benchmarks by Pricing Tier and ARPU
Your average revenue per user (ARPU) is one of the strongest predictors of churn. According to data published by Baremetrics, the pattern is consistent and stark.
| ARPU Range | Avg Monthly Churn | Why |
|---|---|---|
| <$25/month | ~6.1% | Low switching cost, impulsive signups, consumer-like behavior |
| $25–$100/month | ~4.2% | More considered purchases, but still easy to cancel |
| $100–$500/month | ~3.0% | Often involves a team decision; higher integration depth |
| $500–$1,000/month | ~2.3% | Procurement involved; switching is painful |
| >$1,000/month | ~1.8% | Annual contracts, dedicated support, deep workflow integration |
The pattern is clear: higher ARPU means deeper integration, more team members involved, and more dedicated support — all of which create natural switching friction.
The Hidden Churn Problem: Involuntary Churn
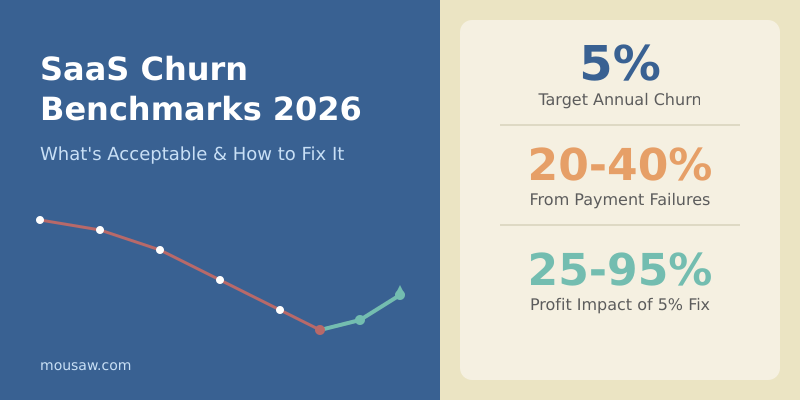
Here’s a number that surprises most founders: 20-40% of all SaaS churn is involuntary. The customer didn’t decide to leave — their credit card expired, the payment failed, and nobody followed up effectively.
Involuntary churn (also called delinquent churn) is revenue lost to failed payments, not failed products. It’s the lowest-hanging fruit in churn reduction, yet many companies treat it as a billing problem rather than a retention problem.
Is Involuntary
Fail Each Year
With Smart Dunning
Common causes of involuntary churn include:
- Expired credit cards — the most common cause; cards expire every 3-4 years
- Insufficient funds — temporary balance issues, especially for SMB customers
- Bank fraud flags — recurring international charges sometimes trigger fraud prevention
- Card network outages — intermittent processor failures
- Address mismatch — customer moves, billing address no longer matches card
The good news: because these customers don’t want to leave, recovery rates are high when you have the right dunning system in place. More on that in the strategies section below.
The fastest way to reduce churn for most SaaS companies isn’t a new feature or a better onboarding flow — it’s fixing the dunning sequence. You’re literally throwing away revenue that customers want to give you.
Six Proven Strategies to Reduce SaaS Churn
Benchmarks are context. What you do with them determines whether your business compounds or stalls. A 5% reduction in churn translates to a 25-95% increase in profitability over time (Bain & Company research). Here are six strategies ordered by typical impact.
1. Fix Your Onboarding (It’s Almost Always the Root Cause)
If I could only fix one thing in a churning SaaS product, it would be onboarding every single time. Customers who reach their “aha moment” within the first session are 3-4x more likely to retain at 90 days.
The mistake most teams make is confusing onboarding with product tours. Real onboarding means getting users to their first time-to-value (TTV) as fast as possible.
Practical steps:
- Define your “aha moment” — the specific action that correlates with retention. For Slack, it’s 2,000 messages. For Dropbox, one file saved. Find yours.
- Remove every step between signup and that moment — defer every field, setting, and choice that isn’t essential.
- Use progressive disclosure — show features when they become relevant, not during setup.
- Set up activation tracking — use event tracking in your analytics platform to measure what percentage of signups reach the aha moment and how long it takes.
Aim for 40%+ activation rate (percentage of new signups who reach your defined “aha moment” within the first 7 days). Below 25% activation almost always correlates with above-benchmark churn.
2. Recover Failed Payments Before They Become Cancellations
Since involuntary churn represents 20-40% of total churn, smart dunning management can deliver immediate ROI. Here’s the playbook:
- Pre-dunning: Email customers 7 days before card expiration asking them to update payment details.
- Smart retry logic: Don’t just retry the same charge at the same time. Spread retries across different times and days — many failures are temporary.
- Multi-channel outreach: Email alone isn’t enough. Add in-app banners, SMS for high-value accounts, and even a phone call for enterprise customers.
- Graceful degradation: Don’t immediately lock the account. Downgrade to a limited version for 7-14 days while you attempt recovery.
Tools like Recurly, Stripe’s built-in Smart Retries, and Paddle’s recovery automation handle much of this. But the email sequence and in-app messaging still need to be custom to your product.
3. Build an Early Warning System
Churn doesn’t happen the day someone clicks “Cancel.” It starts weeks earlier when engagement drops. Build a usage-based early warning system that flags at-risk accounts before they reach the cancellation page.
What to monitor:
- Login frequency drop — a customer who logged in daily and now logs in weekly is at risk
- Feature adoption decline — track usage of your core value features, not vanity metrics
- Support ticket sentiment — escalating frustration in support conversations
- Expansion signals going cold — stopped adding seats, stopped exploring new features
- NPS or CSAT trends — declining scores from individual accounts
Build a simple scoring model. Even a basic spreadsheet that weights these signals and produces a “health score” per account will outperform gut feel.
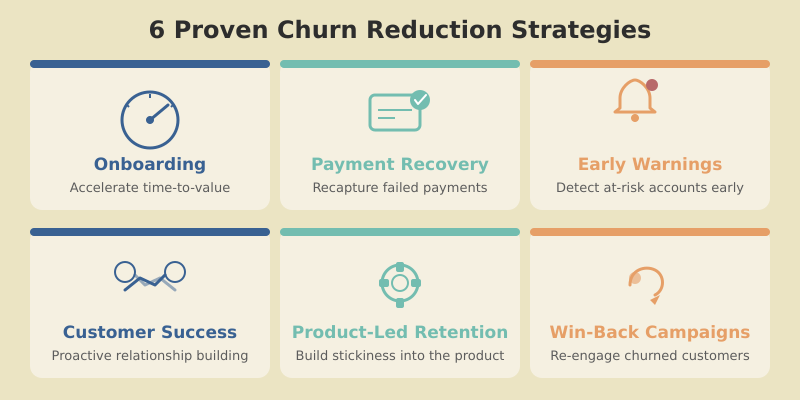
4. Invest in Proactive Customer Success
Reactive support waits for tickets. Proactive customer success reaches out before problems escalate — accounts receiving proactive outreach retain at 2x the rate of those that don’t. You don’t need a large CS team. Start with:
- Automated check-ins at Day 14, Day 30, and Day 90 after signup
- QBRs (Quarterly Business Reviews) for accounts above a revenue threshold
- Triggered outreach when the early warning system flags declining engagement
- Milestone celebrations — acknowledge when customers hit usage milestones (it builds emotional investment)
For many companies, the CS team pays for itself within the first quarter through retained and expanded accounts — a direct investment in your net revenue retention.
5. Use Product-Led Retention
Product-led growth gets all the buzz, but product-led retention is where the compounding happens. Use your product itself to drive deeper adoption and stickiness.
Tactics that work:
- In-app education: Contextual tooltips when users encounter underused features
- Feature adoption campaigns: Guide users to features they haven’t tried but that correlate with retention
- Usage digests: Weekly emails showing value delivered (“You tracked 1,247 events this week, up 15%”)
- Integrations: Every integration a customer sets up is another thread tying them to your product
6. Run Exit Surveys and Win-Back Campaigns
Every churned customer is a data point. Make exit surveys a required step in the cancellation flow — one question, multiple choice, with an optional text field. Common categories: too expensive, missing features, switched to competitor, no longer needed, didn’t understand how to use it, poor support.
Aggregate these monthly and you’ll have a prioritized roadmap for what to fix.
Win-back campaigns target churned customers 30, 60, and 90 days after cancellation with a time-limited offer or a message about new features addressing their exit reason. Win-back conversion rates typically range from 5-15%, far cheaper than acquiring a net-new customer.
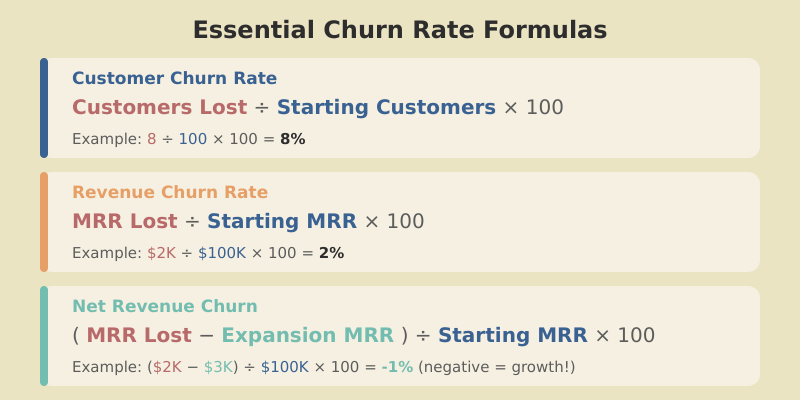
How to Calculate Your Churn Rate (Formulas)
Slight variations in calculation produce wildly different numbers. Here are the three essential formulas.
Customer Churn Rate (Logo Churn)
Customer Churn Rate = (Customers Lost During Period / Customers at Start of Period) x 100
Example: You start January with 500 customers. 20 cancel during the month.
Customer Churn Rate = (20 / 500) x 100 = 4.0%
Revenue Churn Rate (Gross MRR Churn)
Gross MRR Churn Rate = (MRR Lost to Cancellations + MRR Lost to Downgrades) / MRR at Start of Period x 100
Example: Starting MRR is $100,000. You lose $3,000 to cancellations and $1,500 to downgrades.
Gross MRR Churn = ($3,000 + $1,500) / $100,000 x 100 = 4.5%
Net Revenue Churn Rate
Net MRR Churn Rate = (MRR Lost – MRR Gained from Expansion) / MRR at Start of Period x 100
Example: Gross MRR loss is $4,500 (from above). Expansion revenue from upsells and seat additions is $6,000.
Net MRR Churn = ($4,500 – $6,000) / $100,000 x 100 = -1.5%
Negative net churn means your existing base is growing. The metric that makes this explicit is net revenue retention (NRR): in this example, NRR = 101.5%. Top-tier SaaS companies report NRR of 110-130%, generating 10-30% more revenue year-over-year from existing customers alone.
For sustainable long-term SaaS growth, aim for annual net revenue churn of 5% or less. At this level, your acquisition engine isn’t fighting against itself. Above 5% annual net churn, you need exponentially more new revenue just to stay flat — and growth becomes a treadmill instead of a flywheel.
Common Calculation Mistakes to Avoid
- Using end-of-period customer count as denominator: This deflates the rate. Always use start-of-period count.
- Including trial users: Trials that don’t convert aren’t churn — they’re failed acquisitions. Only count paying customers.
- Mixing monthly and annual contracts: Annual customers can only churn at renewal. Blending them with monthly accounts distorts the picture.
- Ignoring seasonality: B2B tools often see higher churn in Q1 as companies review budgets. Track rolling averages.
Remember: these benchmarks are medians — your vertical, pricing model, and contract length will shift what’s healthy. Use these numbers as a starting point, then build your own cohort-level benchmarks over time.
Frequently Asked Questions
Conclusion
Knowing your saas churn rate benchmarks is the starting point, not the finish line. If your early-stage SaaS is at 6% monthly churn, you’re at median — but median shouldn’t be your ambition.
Here’s my recommended action plan:
- Separate your metrics — track customer churn and revenue churn independently, segmented by plan tier.
- Fix involuntary churn first — it’s the highest-ROI, lowest-effort improvement available.
- Invest in onboarding — shorten time-to-value ruthlessly. Measure activation rates weekly.
- Build early warning signals — don’t wait for cancellations to understand who’s at risk.
- Make retention a product problem — product-led retention compounds in ways that human-led efforts can’t match at scale.
A 5% reduction in churn can increase profitability by 25-95% over time. That’s the compounding effect of keeping customers who keep paying, who keep expanding, and who keep referring. Churn is the inverse of the value you deliver. Fix the value, and the number takes care of itself.