Here’s an uncomfortable truth: the global content marketing industry is projected to reach $107 billion by 2026, yet only 29-43% of content marketers can measure whether their investment is actually working. That’s billions of dollars flowing into content programs with no clear line to revenue.
I’ve seen this gap firsthand. When I ran a content audit for a B2B SaaS client last year, their team was celebrating a 140% increase in blog traffic. But when we traced those sessions through the pipeline, only 3% of new visitors ever reached a product page. Pageviews were up. Revenue attribution was invisible. The CMO was two quarters away from cutting the content budget entirely.
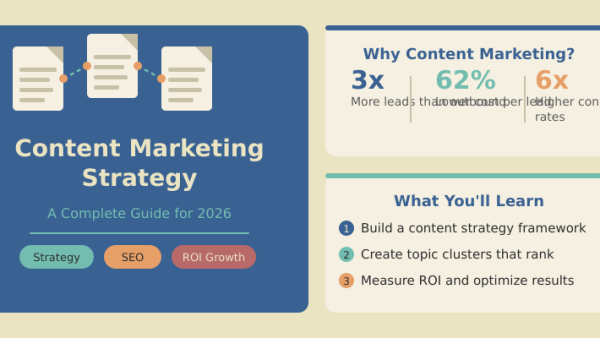
This guide is about closing that gap. You’ll learn how to measure content marketing ROI with metrics that connect to revenue, not vanity dashboards. I’ll walk you through the ROI formula, ten metrics that actually matter, attribution models that work in practice, and how to build a reporting system that keeps your content budget safe.
Table of Contents
Why Pageviews Don’t Tell the Story
Pageviews are the most-reported content metric — and the least useful for proving business value. When 83% of marketing leaders say demonstrating ROI is a top priority, but only 36% can actually do it, there’s a disconnect between what teams measure and what stakeholders need to hear.
The problem with vanity metrics is simple: they measure activity, not impact. A blog post that generates 50,000 visits and zero pipeline contributions is a cost center. A post with 2,000 visits that influences $400K in closed deals is your best-performing asset. But if you’re only looking at pageviews, you’d never know the difference.
Stakeholders want to know: How much revenue did content generate? What’s our cost per lead versus paid? Which pieces influence the most pipeline? Is content shortening our sales cycle? If your reporting can’t answer those questions, you’re measuring the wrong things. And if you’re building your content marketing strategy without a measurement framework, you’re flying blind.
The best content marketers don’t measure success by how much content they produce. They measure it by how much revenue that content influences. Everything else is a leading indicator at best, a vanity metric at worst.
Founder, Content Marketing Institute
The Content Marketing ROI Formula
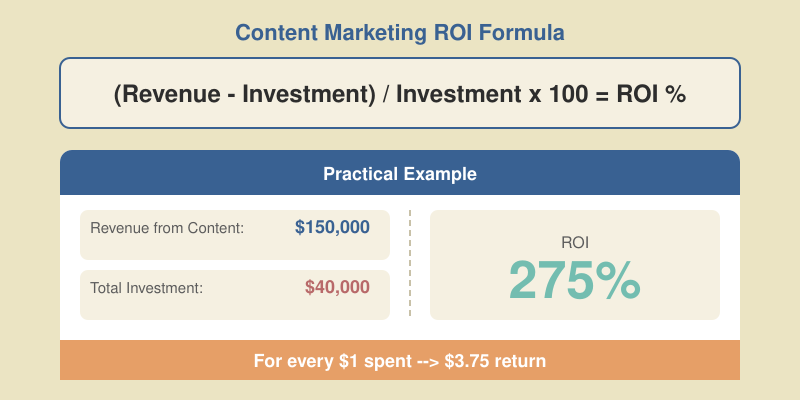
The basic content marketing ROI formula is straightforward:
(Revenue Generated from Content – Total Content Investment) / Total Content Investment x 100 = ROI %
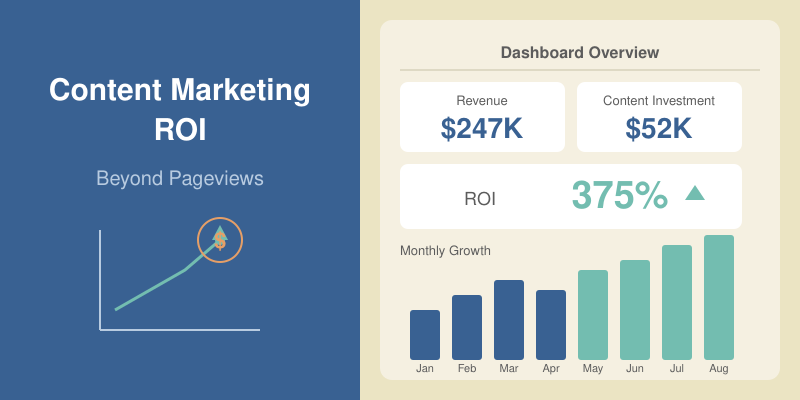
If you spend $50,000 on content in a quarter and that content generates $200,000 in attributable revenue, your ROI is 300%. Simple math. The hard part is accurately calculating both sides of the equation.
What Counts as “Total Investment”
Most teams undercount their content costs, which inflates ROI numbers. Include everything: people costs (salaries, freelancers, agencies), tool costs (SEO platforms, CMS, analytics, AI tools), distribution costs (paid promotion, syndication), production costs (design, video, editing), and overhead (management time, strategy meetings, audits).
A Practical Calculation Example
Let’s say your quarterly content costs look like this:
| Cost Category | Quarterly Spend |
|---|---|
| Content team salaries (2 writers, 1 editor) | $45,000 |
| Freelance writers | $8,000 |
| SEO and analytics tools | $3,000 |
| Design and production | $4,000 |
| Paid distribution (LinkedIn, syndication) | $5,000 |
| Total Investment | $65,000 |
Now, through attribution tracking you determine that content influenced $260,000 in closed-won revenue during the same period. Your ROI calculation:
($260,000 – $65,000) / $65,000 x 100 = 300% ROI
That’s a 4:1 return — right in line with the median 4.33:1 revenue return that successful brands achieve. B2B content marketing generates an average 3:1 ROI, but with proper SEO and compounding organic traffic, returns can reach as high as 748% over a multi-year period.
The ROI formula is simple. The challenge is accurate attribution on the revenue side and honest accounting on the cost side. Undercount costs and you’ll overstate ROI. Use single-touch attribution and you’ll misattribute revenue. Get both right and you have a defensible number for your stakeholders.
10 Metrics That Actually Measure Content ROI
Pageviews tell you people showed up. These ten metrics tell you whether your content is actually driving business outcomes. I’ve ranked them by how directly they connect to revenue.
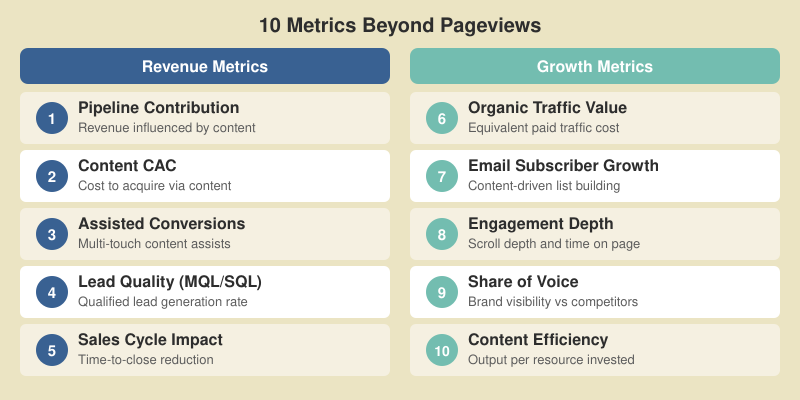
1. Pipeline Contribution and Influenced Revenue
This is the north star metric. It measures the dollar value of deals in your pipeline where a content touchpoint appeared in the buyer journey. If a prospect read your comparison guide, downloaded your whitepaper, and then requested a demo, that deal is “content-influenced.”
Best-in-class B2B content teams influence 40-60% of total pipeline. If you’re below 20%, your content is likely too top-of-funnel or disconnected from buyer intent.
2. Customer Acquisition Cost (CAC) from Content
Calculate CAC specifically for content-sourced leads: total content spend divided by the number of customers acquired through content channels. Then compare it to your paid acquisition CAC. Content-sourced leads typically cost 62% less than paid search leads — and that gap widens over time as your organic library compounds.
3. Content-Assisted Conversions
In B2B, 40-60% of conversions are assisted — meaning the buyer touched multiple pieces of content before converting. Single-touch attribution misses these entirely. Track how many conversions had at least one content touchpoint in the path, even if content wasn’t the first or last click. This metric reveals the true scope of content’s influence across your funnel.
4. Lead Quality Score: MQL-to-SQL Ratios
Not all leads are equal. Track the MQL-to-SQL conversion rate for content-sourced leads versus other channels. If your blog generates lots of MQLs but they rarely convert to SQLs, you have a targeting problem, not a volume problem. High-quality content attracts buyers who fit your ICP. Low-quality content attracts curious browsers who will never buy.
5. Sales Cycle Length Impact
Does content shorten the time from first touch to closed deal? Measure the average sales cycle for deals where buyers engaged with content versus deals where they didn’t. Content that educates prospects before the sales conversation — product comparisons, ROI calculators, technical documentation — can compress cycles by 20-30%. That acceleration has real dollar value.
6. Organic Traffic Value
What would you pay in Google Ads for the organic traffic your content generates? Calculate this by multiplying each ranking keyword’s monthly search volume by its estimated CPC. If your content drives 50,000 organic visits per month for keywords that cost $8-$15 per click in ads, you’re generating $400K-$750K in equivalent ad spend annually. Tools like Ahrefs and Semrush automate this calculation.
7. Email Subscriber Growth from Content
Your email list is a compounding asset. Track how many new subscribers each content piece generates and the downstream conversion rate of those subscribers. A blog post that adds 200 subscribers per month who convert at 3% to trial is directly measurable pipeline. This is a clear way to connect content to a SaaS growth engine.
8. Engagement Quality: Time on Page and Scroll Depth
These are engagement metrics, not vanity metrics — when used correctly. A 3,000-word guide with an average read time of 45 seconds means nobody is reading it. The same guide with 8 minutes average read time and 75% scroll depth tells you the content resonates. Use these as quality signals, not success metrics.
9. Share of Voice and Topic Authority
Share of voice measures what percentage of search results for your target keywords feature your content. If you target 50 keywords in your content cluster and rank in the top 10 for 30 of them, your share of voice is 60%. Track this monthly — it’s a leading indicator of whether your content investment is building the topical authority that drives long-term organic growth.
10. Content Efficiency Ratio
Divide the total revenue attributed to content by the total number of content pieces published. This tells you the average revenue per article — and helps you identify which content types deliver the highest return. If your case studies generate $50K per piece in influenced revenue but your listicles generate $2K, you know where to shift investment.
You don’t need to track all ten metrics from day one. Start with pipeline contribution and content-sourced CAC. Add content-assisted conversions once your attribution is solid. Layer in the rest as your measurement maturity grows. Imperfect data that you act on beats perfect data that you never collect.
Attribution Models Explained
Attribution is where content ROI measurement gets complicated — and where most teams give up. The buyer’s journey in B2B involves 6-8 touchpoints across weeks or months. Which touchpoint gets credit for the conversion? That’s the attribution problem.
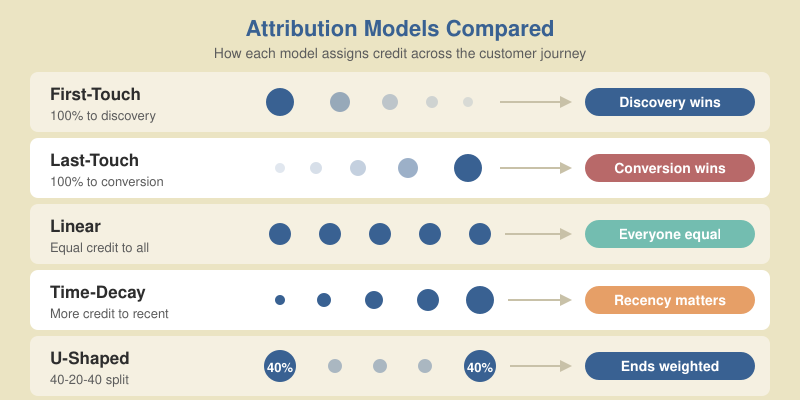
Here are the five models you need to know:
| Model | How It Works | Best For | Limitation |
|---|---|---|---|
| First-Touch | 100% credit to the first interaction | Understanding what drives awareness | Ignores everything after discovery |
| Last-Touch | 100% credit to the final interaction before conversion | Understanding what closes deals | Ignores the entire nurture journey |
| Linear | Equal credit to every touchpoint | Simple fairness across channels | Treats all touches as equally important |
| Time-Decay | More credit to recent touchpoints | Long sales cycles with gradual engagement | Undervalues early awareness content |
| U-Shaped (Position-Based) | 40% to first touch, 40% to last, 20% split among the rest | Balanced view of discovery and conversion | Arbitrary weight distribution |
Which Model Should You Use?
For short sales cycles (under 30 days), first-touch or last-touch captures most of the story. For long B2B cycles (60-180 days), U-shaped or time-decay works best — they credit both awareness and closing content. For content-heavy funnels, linear attribution prevents you from undervaluing mid-funnel nurture content.
Attribution isn’t about finding the single truth. It’s about building a model that’s defensible, consistent, and actionable. Pick one, apply it uniformly, and use it to make better investment decisions quarter over quarter.
Co-founder, SparkToro
Setting Up Attribution in GA4
GA4 has multi-touch attribution built in (for a full walkthrough, see my GA4 complete guide). The setup: mark key actions as conversion events, tag every distribution channel with consistent UTM parameters, enable data-driven attribution, and use path exploration reports to see which content appears most in pre-conversion journeys. Whatever model you choose, apply it uniformly across all reporting periods — switching mid-year makes comparisons meaningless.
Don’t let attribution paralysis stop you from measuring anything. Start with last-touch attribution because it’s the simplest to implement. Then layer in multi-touch once you have the tracking infrastructure in place. A rough attribution model you consistently use is infinitely better than no model at all.
How to Build a Content ROI Dashboard
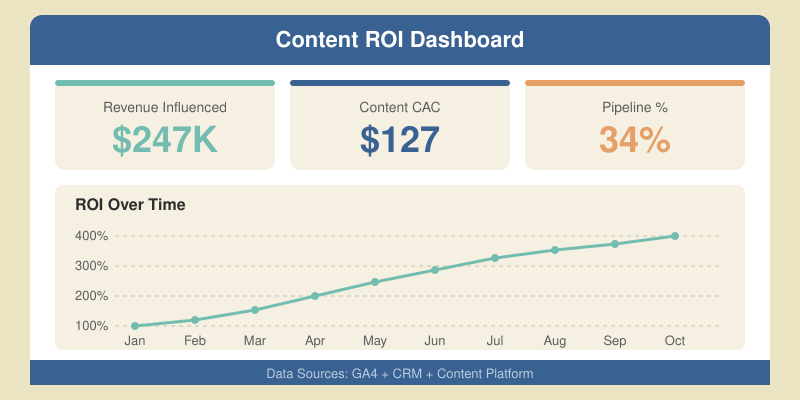
Don’t build a dashboard for the content team — build one for the people who control your budget. Most B2B teams need just three tools: GA4 for traffic, engagement, and attribution data (see Google’s official documentation); a CRM (HubSpot, Salesforce) to connect content touchpoints to deals and revenue; and Looker Studio to pull both data sources into a single visual dashboard.
What to Show Stakeholders Monthly
Keep monthly reports focused on trends and leading indicators:
What to Show Stakeholders Quarterly
Quarterly is where you make the revenue case: total content ROI compared to previous quarter, content-influenced revenue in dollars, top 10 pieces by revenue influence, content efficiency ratio trending over time, and channel comparison (content vs. paid vs. outbound). The goal is a single-page view that answers: “Is content worth the investment?” If it answers that clearly, your budget is safe.
If you can’t measure it, you can’t improve it. But more importantly, if you can’t communicate it, you can’t fund it. The best content marketers are also the best storytellers about their own performance.
Chief Strategy Advisor, Content Marketing Institute
The ROI Timeline: Why Content Takes Time
This is the section I wish every CFO and VP of Marketing would read before setting expectations. Content marketing typically takes 9-18 months to break even and start showing positive ROI. That’s not a failure — it’s the nature of a compounding asset.
Leading vs. Lagging Indicators
The mistake teams make is waiting for lagging indicators (revenue, closed deals) to validate content investment. If leadership panics at month 4 because revenue attribution is zero, the program dies before it compounds. Define leading indicators that prove the program is on track:
| Timeline | Leading Indicators | What They Signal |
|---|---|---|
| Months 1-3 | Keyword rankings improving, organic impressions growing, email list growing | Content is being indexed and discovered |
| Months 4-6 | Organic traffic increasing, engagement metrics strong, first MQLs appearing | Content resonates with the right audience |
| Months 7-12 | Content-assisted conversions appearing, pipeline influence growing, CAC trending down | Content is converting, not just attracting |
| Months 12-18 | Positive ROI, compounding organic traffic, content-influenced revenue growing | The flywheel is spinning |
How to Set Expectations
Present content investment like any compounding asset: returns are back-loaded. A content marketing strategy built on topic clusters is more like real estate than a paid ad campaign. The first year builds equity; returns accelerate in year two and beyond. With proper SEO, B2B content delivers returns of 748% over multi-year horizons. But teams that quit at month 6 see zero — and conclude “content doesn’t work.”
68% of businesses report higher content marketing ROI after adopting AI tools for content production. AI doesn’t change the compounding timeline for organic traffic — Google still takes months to fully rank content. But it dramatically reduces production costs, which means you hit positive ROI sooner because the denominator (investment) is smaller.
Frequently Asked Questions
Start Measuring What Matters
The gap between content marketing investment and content marketing ROI measurement is the single biggest threat to content budgets everywhere. When only 29% of marketers can prove their content’s value, the other 71% are one budget review away from cuts.
But measuring ROI isn’t as complicated as it seems. Start with the formula: revenue generated minus investment, divided by investment. Get honest about your costs. Set up attribution — even imperfect attribution is better than none. Track pipeline contribution as your north star metric. Build a dashboard that answers the questions your stakeholders actually ask.
The brands that measure well aren’t just protecting their budgets. They’re compounding their investment. When you know which content drives revenue, you can double down on what works and cut what doesn’t. That’s how you move from a median 3:1 return to the 4.33:1 that top performers achieve.
If you haven’t already, revisit your content marketing strategy with measurement built in from the start. Then use content optimization tools to ensure every piece you publish is worth measuring in the first place. Content that no one reads has no ROI to measure — so quality and distribution still come first.
The $107 billion content marketing industry will keep growing. The question is whether your share of that investment is generating returns — or just generating pageviews.